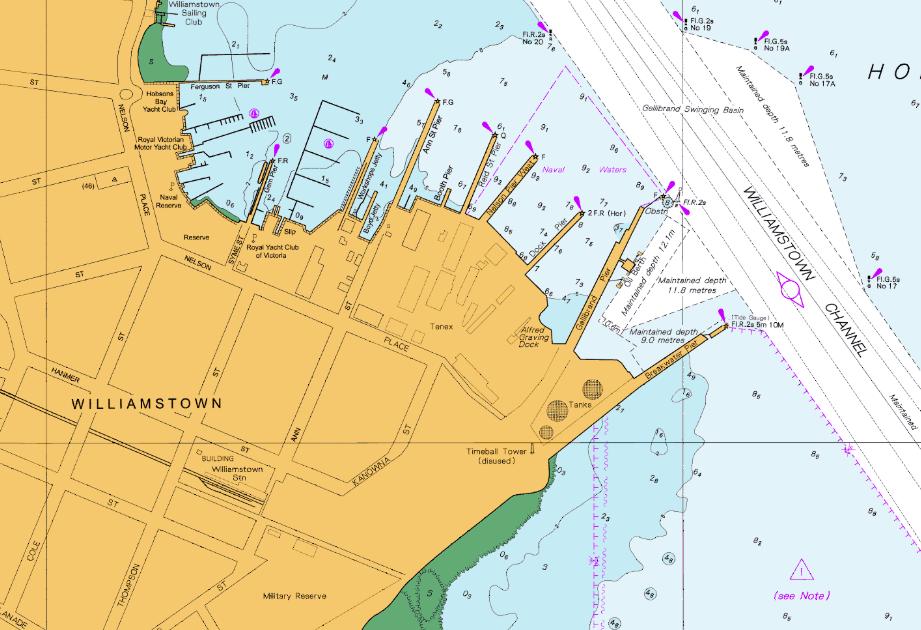
Navigating the seas is an age-old skill that requires careful preparation and precision. One essential tool used by sailors, navigators, and even fishermen for centuries is nautical charts. These detailed maps provide invaluable information about the marine environment, from underwater features to potential hazards. But beyond their practical purpose, there are some fascinating facts about these charts that many may not know.
Nautical Charts Were Once Hand-Drawn
Before the advent of modern technology, all nautical charts were painstakingly hand-drawn. Cartographers would create detailed illustrations of coastlines, bays, and harbours, often spending months or years gathering data through observation and measurements. This was a time-consuming process, with explorers like Captain James Cook contributing immensely to the early collection of data for charts during the 18th century.
They Have a Secret Code
Nautical charts are far from ordinary maps; they contain a secret language. The symbols used on these charts have specific meanings and are designed to communicate complex information efficiently. For example, a dotted line represents a channel, while a black square indicates a lighthouse. These symbols help sailors quickly understand the conditions they might encounter without needing to read through lengthy explanations.
Charts Can Be Updated Regularly
While nautical charts may seem like static documents, they are regularly updated to reflect changes in the environment. Natural events such as shifts in the coastline, new underwater obstacles, or the construction of new ports can all require revisions. Many countries have official bodies that monitor and update charts, ensuring that navigational information remains accurate.
Marine Charts Are Used by More Than Just Sailors
While most people associate charts with sailors, they are also used by a variety of professionals, from marine biologists to archaeologists. Marine charts can help researchers study underwater ecosystems or locate shipwrecks, and they are often used to assess the impact of climate change on coastal areas.
The Birth of Modern Technology
In today’s digital age, nautical charts have evolved significantly. The introduction of GPS and digital charting software has revolutionised navigation, allowing for real-time data and improved accuracy. However, the core principles of these charts remain the same, relying on detailed topographical data of the seafloor and surrounding waters.
Nautical charts are far more than mere maps—they are vital tools in the history of navigation and still play a crucial role in modern maritime activities. Whether hand-drawn or digital, these charts continue to guide sailors, researchers, and explorers across the world’s oceans.
